Feb. 19, 2023
Pycairo: Image Drawing Guide with Python
How to draw images with Pycairo
Drawing vector images with Python is simple. Pycairo is a library that does everything for you!
Introduction
Drawing vector and computer graphics is very tricky without libraries to handle the basics. Cairo is a handy graphics library - it specializes in drawing vector graphics - and despite its use in several popular programs, such as Inkscape and (until recently) Manim, there isn’t much information on the Internet about how to use it.
The Cairo library was written in C. This tutorial focuses on Pycairo, a module with helpful Python bindings for Cairo. Together we’ll dive into the basics of Pycairo and vector graphics.
Why Pycairo?
Cairo is a versatile library. Unlike alternatives (such as PIL), Pycairo was built to handle the drawing of vector graphics, and the library performs remarkably well in a wide variety of cases. With the Pycairo bindings, we have the flexibility to draw:
- Rectangles
- Arc, Circles, and Ellipses
- Lines
- Bézier curves
- Complex Polygons
- Gradients (both Radial and Linear)
And we can also set the properties of what we draw, such as:
- Color
- Line width & Line color
- Scaling (in both the x and y directions)
How to Set Up Pycairo
Setting up Pycairo on your computer is simple. Run this pip command in your virtual environment or wherever you install your packages:
pip install pycairo
There are also several dependencies you may need to install, which are listed here.
Once the module is installed, simply make a new python file and import it. If you don’t get any errors, everything should be set up correctly.
import cairo
Context and Surfaces
To draw a shape in Pycairo, it's helpful to understand the differences between the Surface and the Context.
The Surface is an abstract type that represents the target surface (the image Pycairo will be drawing to). For example, to render an SVG image with a width of 400px and a height of 500px, you could do this:
import cairo
surface = cairo.SVGSurface('surface.svg', 400, 500)
Context in Pycairo is the main object that we’ll be using: the Context performs the drawing commands we give it. You can define a surface and context like so:
ctx = cairo.Context(surface)
Additionally, if you’d prefer to have more control over the surface you define (such as the pixel format), you can also do that:
surface_32 = cairo.ImageSurface(cairo.FORMAT_ARGB32, 350, 350)  # 32-bit color
surface = cairo.ImageSurface(cairo.FORMAT_RGB24, 350, 350)  # 24-bit color
For the purposes of this tutorial, we’ll be using cairo.FORMAT_RGB24. Now we can get into drawing basics.
Drawing Lines and Bézier Curves
One of the best things about Pycairo and Cairo, in general, is their ability to draw lines and Bézier curves. In fact, any shape built in Cairo can be built using two different methods: line_to() and curve_to().
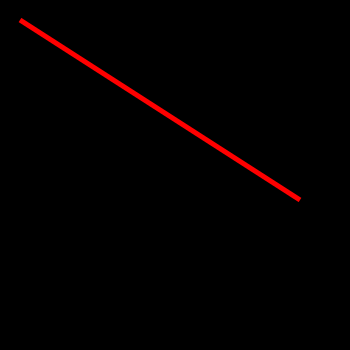
line_to() draw a simple line, starting by moving to the start point and then drawing to the end point. Points are defined starting from the top-left. To get the line to actually show up, we need to run the context's stroke() method.
import cairo

surface = cairo.ImageSurface(cairo.FORMAT_RGB24, 350, 350)
ctx = cairo.Context(surface)

ctx.move_to(20, 20)
ctx.line_to(300, 200)
ctx.set_line_width(5)
ctx.set_source_rgba(1, 0, 0)
ctx.stroke()
surface.write_to_png('new_img.png')
We told the surface to write to a new_img.png file, with
surface.write_to_png('new_img.png')
Colors in Pycairo are, by default, normalized between 0 and 1, but the order of the tuple is the same (red, green, blue). This essentially draws (255, 0, 0), or pure red. See the Color section for more information.
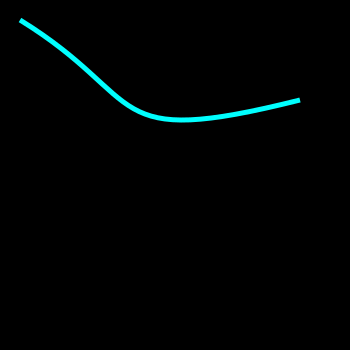
Bézier curves are smooth parametric curves that are commonly used in computer graphics. Pycairo works with cubic bézier curves, which consists of a start point, an end point, and two intermediate control points. Here's an example,
import cairo

surface = cairo.ImageSurface(cairo.FORMAT_RGB24, 350, 350)
ctx = cairo.Context(surface)
# 2 and 3 are control points
ctx.move_to(20, 20) # x1, y1 (start point)
ctx.curve_to(150, 100, 100, 150, 300, 100) # x2, y2, x3, y3, (x4, y4 is endpoint)
ctx.set_line_width(5)
ctx.set_source_rgba(0, 1, 1)
ctx.stroke()
surface.write_to_png('new_img.png')
Complex Shapes
Using what we learned so far, we are able to draw complex shapes. Here's an example:
import cairo

surface = cairo.ImageSurface(cairo.FORMAT_RGB24, 350, 350)
ctx = cairo.Context(surface)

ctx.move_to(20, 20)
ctx.curve_to(150, 100, 100, 150, 300, 100)
ctx.line_to(300, 100)
ctx.line_to(100, 250)
ctx.curve_to(75, 75, 100, 150, 20, 20)
ctx.set_line_width(5)
ctx.set_source_rgba(0, 1, 1)
ctx.fill()
surface.write_to_png('new_img.png')
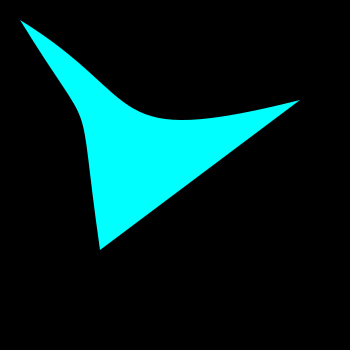
To actually get a result onto the screen we called .fill(), which fills the shape with the color we specified. Without fill(), this is what we get:

Draw a Rectangle
In this example, we’ll draw a rectangle to a .png file.
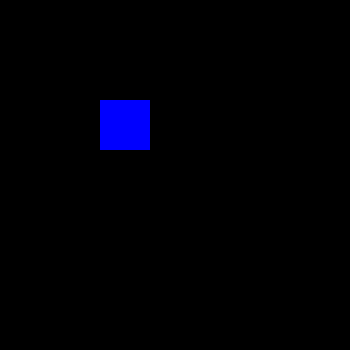
Pycairo has special methods for drawing some basic shapes, such as rectangles and arcs, so this is all we need to do to draw a blue rectangle onto the screen:
import cairo
surface = cairo.ImageSurface(cairo.FORMAT_RGB24, 350, 350)
ctx = cairo.Context(surface)

ctx.rectangle(100, 100, 50, 50)  # parameters are x, y, width, height
ctx.set_source_rgb(0, 0, 1)
ctx.fill()
surface.write_to_png('new_img.png')
The parameters of the rectangle path begin with x and y, the starting coordinate (pixels away from the top-left of the image), and the width and height of the shape.
Draw Circles, Arcs, and Ellipses
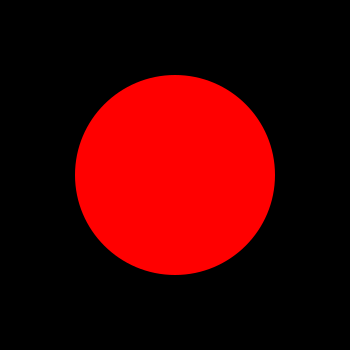
To draw circles in Pycairo, we actually have to draw an arc like so
import cairo
import math
surface = cairo.ImageSurface(cairo.FORMAT_RGB24, 350, 350)
ctx = cairo.Context(surface)

ctx.arc(175, 175, 100, 0, 2 * math.pi) # center_x, center_y, radius, angle_start, angle_end
ctx.set_source_rgb(1, 0, 0)
ctx.fill()
surface.write_to_png('new_img.png')
There are several things going on here: for one, we have to define arcs with radian angles (hence the 2 * math.pi for 360 degrees). We can position the element using the center coordinate.
Drawing an arc is, of course, even simpler:
ctx.arc(175, 175, 100, 0, math.pi / 2)
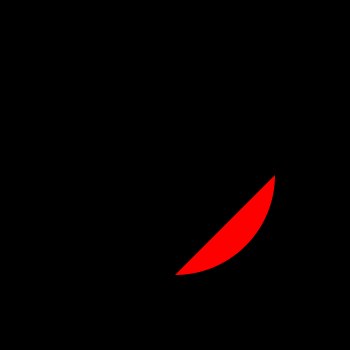
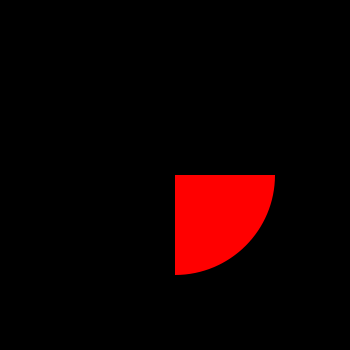
Notice how the arc doesn't start in the middle as you may have expected? To make a sector, we need to use close_path(), which closes the shape's path by moving back to the start coordinate. First we, need to define that start coordinate:
ctx.move_to(175, 175)  # defines start coordinate
ctx.arc(175, 175, 100, 0, math.pi / 2)
ctx.close_path()
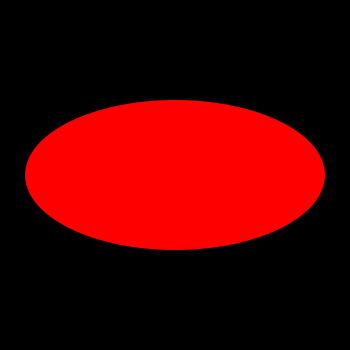
Great, now for ellipses! Pycairo can't draw an ellipse by itself, so we need to instead scale a circle (in the y direction). Here's how we can do that to make an ellipse of size (300, 200):
import cairo
surface = cairo.ImageSurface(cairo.FORMAT_RGB24, 350, 350)
ctx = cairo.Context(surface)
img_width, img_height = 400, 400
shape_target_width, shape_target_height = 300, 150
radius = shape_target_width / 2
scale_x = 1.0
scale_y = shape_target_height / shape_target_width
ctx.scale(scale_x, scale_y)
ctx.arc(175, 175 / scale_y, radius, 0, math.pi * 2)
ctx.set_source_rgb(1, 0, 0)
ctx.fill()
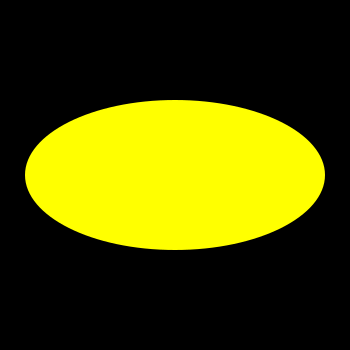
We can also do the same thing in the x direction:
import cairo
surface = cairo.ImageSurface(cairo.FORMAT_RGB24, 350, 350)
ctx = cairo.Context(surface)
img_width, img_height = 400, 400
shape_target_width, shape_target_height = 300, 150
radius = shape_target_height / 2
scale_x = shape_target_width / shape_target_height
scale_y = 1
ctx.scale(scale_x, scale_y)
ctx.arc(175 / scale_x, 175, radius, 0, math.pi * 2)
ctx.set_source_rgb(1, 1, 0)
ctx.fill()
Colors
Recall how the RGB values in the previous sections were between 0 and 1? That's annoying. How can we change that?
Let’s create a function to give us some options. The function will allow us to type RGB (both normalized and regular), hex (like "#FFFF00"), and HTML color names (such as "dodgerblue"). To do so we’ll need to install a new module, webcolors, and import it.
import webcolors
# format color
def format_color(*color, **kwargs):  # color is a tuple
    alpha = 1 if 'alpha' not in kwargs else kwargs['alpha']
    if isinstance(color[0], str):
        color = color[0].strip().lower()
        if color[0] == '#':
            # assume hex
            rgb = list(webcolors.hex_to_rgb(color))
        else:
            # assume color name
            rgb = list(webcolors.name_to_rgb(color))
    elif isinstance(color, (list, tuple)):
        rgb = color[:3]  # gets first three values in list
        if len(color) == 4:
            alpha = color[3]
        too_big = [x for x in rgb if x > 1]
        if not too_big:
            return color
    else:
        rgb = [0, 0, 0]  # sets default color to black

    normalized_rgb = [x / 255 for x in rgb]
    normalized_rgb.append(alpha)

    return normalized_rgb
You'll notice that the resulting list from format_color() contains a 4th value, which is the alpha value for transparency. Because we now have a RGBA value, to set the source color, we can do this:
ctx.rectangle(100, 100, 50, 50)

new_color = format_color('lightgreen', alpha=0.5) #
First, we use the format_color() function to get the normalized RGBA values for 'lightgreen'. Then, we set_source_rgba() of the context with that color ( "*" simply expands the list to the parameters of the method).
Here's the resulting image without the alpha value:
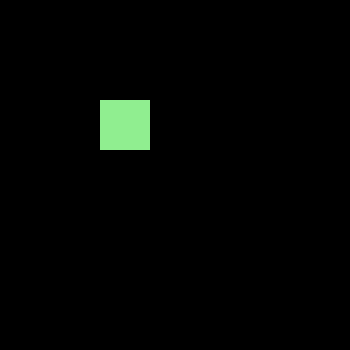
And here's the rendered image with the alpha value set at 0.5:
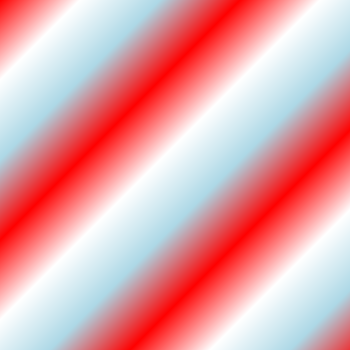
Linear Gradients
We've covered basic colors, now it's time for gradients. With linear gradients, color flows in a single direction. Here’s how we can make a linear gradient and apply it to a shape.
First we define the LinearGradient object. LinearGradient parameters consist of: the start coordinate, the end coordinate, and possible intermediate color-stop coordinates.
linear_gradient = cairo.LinearGradient(0.0, 0.0, 400.0, 400.0) # diagonal
To add colors, we can either input normalized RGBA values ourselves, or we can take advantage of the format_color function from the previous section.
linear_gradient = cairo.LinearGradient(0.0, 0.0, 400.0, 400.0)
colors = [format_color('red'), format_color('white'), format_color('lightblue')]

step_size = 0.1
i = 0
count = 0
while i < 1:
    color = colors[count % len(colors)]
    linear_gradient.add_color_stop_rgba(i, *color)
    i  = step_size
    count  = 1

ctx.rectangle(0, 0, 400, 400)
ctx.set_source(linear_gradient)
ctx.fill()
surface.write_to_png('new_img.png')
The above code takes a list of colors and iterates through it (starting at the beginning of the list when necessary, hence the modulo). Each color is added to the linear gradient using add_color_stop_rgba() until the gradient is filled (i = 1). Essentially, the variable i tracks the percent of completion of the gradient.
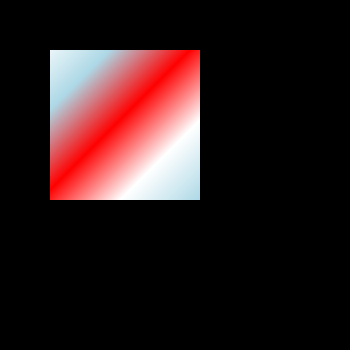
If we change the size of the rectangle, the amount of the gradient that is visible also changes:
ctx.rectangle(50, 50, 150, 150)
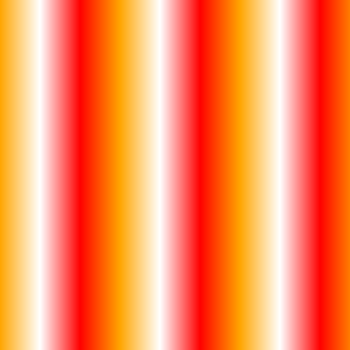
We can also do vertical stripes:
linear_gradient = cairo.LinearGradient(0.0, 0.0, 400.0, 0.0) # vertical
colors = [format_color('orange'), format_color('white'), format_color('red')]
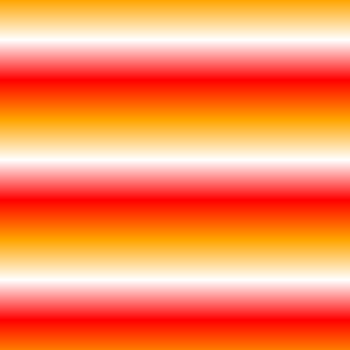
And horizontal stripes:
linear_gradient = cairo.LinearGradient(0.0, 0.0, 0.0, 400.0)
colors = [format_color('orange'), format_color('white'), format_color('red')]
Radial Gradients
Radial gradients deserve their own section. Unlike Linear Gradients, these can be defined from two circles, each with a center x, y, and radius. Let's see an example of a RadialGradient which is set as a rectangle's source.
radial_gradient = cairo.RadialGradient(0.0, 0.0, 50.0, 0.0, 0.0, 200.0) # first circle center at (0, 0) with radius 50. second circle center (0, 0) with radius 200
colors = [format_color('orange'), format_color('white'), format_color('red')]

step_size = 0.1
i = 0
count = 0
while i < 1:
    color = colors[count % len(colors)]
    radial_gradient.add_color_stop_rgba(i, *color)
    i  = step_size
    count  = 1

ctx.rectangle(0, 0, 400, 400)
ctx.set_source(radial_gradient)
ctx.fill()
surface.write_to_png('new_img.png')

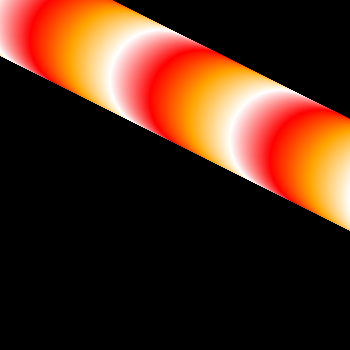
With RadialGradients we can make some pretty interesting effects :)
radial_gradient = cairo.RadialGradient(0.0, 0.0, 50.0, 400.0, 200.0, 50.0)
colors = [format_color('orange'), format_color('white'), format_color('red')]

step_size = 0.1
i = 0
count = 0
while i < 1:
    color = colors[count % len(colors)]
    radial_gradient.add_color_stop_rgba(i, *color)
    i  = step_size
    count  = 1

ctx.rectangle(0, 0, 400, 400)
ctx.set_source(radial_gradient)
ctx.fill()
surface.write_to_png('new_img.png')
Line Width/Outline
With Pycairo, we don't have to fill the shape. In fact, we have several options. What if we simply want to draw the border of the shape? Well, we can do that!
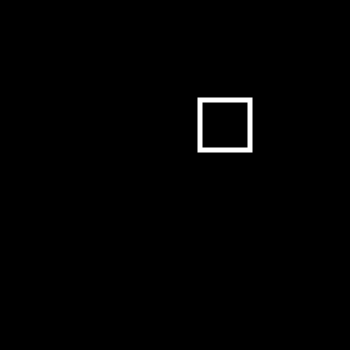
In the below example, we set the line_width to be 5 pixels and draw the white outline of a rectangle. Instead of using fill(), we used stroke(). stroke() is used when we only want the outline of a shape.
ctx.rectangle(200, 100, 50, 50)  # parameters are, once again, x, y, width, height
second_color = format_color('white') # unnecessary but :)
ctx.set_line_width(5)
ctx.set_source_rgba(*second_color)
ctx.stroke()
surface.write_to_png('new_img.png')
Cairo allows us to preserve the current path in the Context object so we can do multiple drawing operations on a given path/shape.
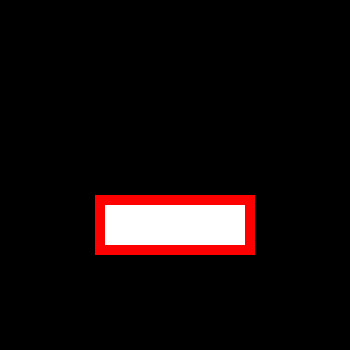
stroke() doesn't allow us to also fill a shape, so we need a new method. fill_preserve() fills the shape but allows us to stroke() it later, so that will be able to draw on to of a filled shape with an outline, like so:
ctx.rectangle(100, 200, 150, 50)  # parameters are x, y, width, height
fill_color = format_color('white')
border_color = format_color('red')

ctx.set_source_rgba(*fill_color)
ctx.fill_preserve()

ctx.set_line_width(10)
ctx.set_source_rgba(*border_color)
ctx.stroke()

surface.write_to_png('new_img.png')
We start by setting the rectangle path and color, and then fill_preserve() the context. Finally, we change to the border color and apply the border.
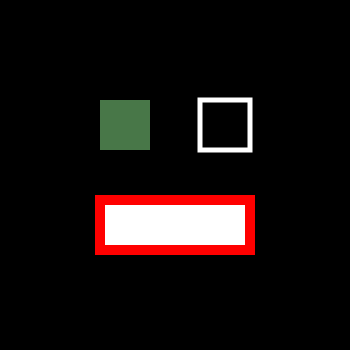
Now, just for fun, let's combine a few shapes into a single image:
# first rectangle
ctx.rectangle(100, 100, 50, 50)
new_color = format_color('lightgreen', alpha=0.5)
ctx.set_source_rgba(*new_color)
ctx.fill()

# second rectangle
ctx.rectangle(200, 100, 50, 50)
second_color = format_color('white')
ctx.set_line_width(5)
ctx.set_source_rgba(*second_color)
ctx.stroke()

# third rectangle
ctx.set_line_width(10)
ctx.rectangle(100, 200, 150, 50)
fill_color = format_color('white')
border_color = format_color('red')

ctx.set_source_rgba(*fill_color)
ctx.fill_preserve()
ctx.set_source_rgba(*border_color)
ctx.stroke()

surface.write_to_png('new_img.png')
Alright, that's the basics!
Contact info: [email protected]